Intraday Volume Analysis

Volume and Volatility
Figure 1 below plots the total range vs. the volume of regular-session trading of a recent CME S&P 500 e-mini futures contract. This plot suggests a strong positive-feedback relationship between intraday volatility and trading volume for this contract.
Figure 1: Session range vs. volume
Figure 2: Comparison of time-based and volume-based range
During the time period detailed in Figure 1 above, the average session volume was 1.64 million contracts, or approximately 21,000 contracts for each 5-minute period of the 390-minute regular session. Figure 2 compares the probabilities that a 5-minute period or a 5-minute volume-equivalent period exhibited a given range. The distribution for volume-equivalent periods is noticeably more compact than that for time-based periods. The data also suggest that liquidity in this market is both finite and ubiquitous: Tight consolidations on heavy volume are relatively rare, but the ability of a given amount of volume to move price falls off relatively rapidly.
Volume Accumulation
One reason for the variability in range observed over time-based periods is that volume accumulation rates are not constant throughout the session. Intraday, regular-session volume rates for US markets follow a well-known pattern: A sustained high level of activity from the open until mid-morning, a sharp drop during the late morning and lunch hours, and finally an afternoon pickup and surge into the close. Under the simplifying assumption that this pattern is more or less the same during every session, accumulating volume at fixed intervals over many sessions provides a profile of volume accumulation for the average session.
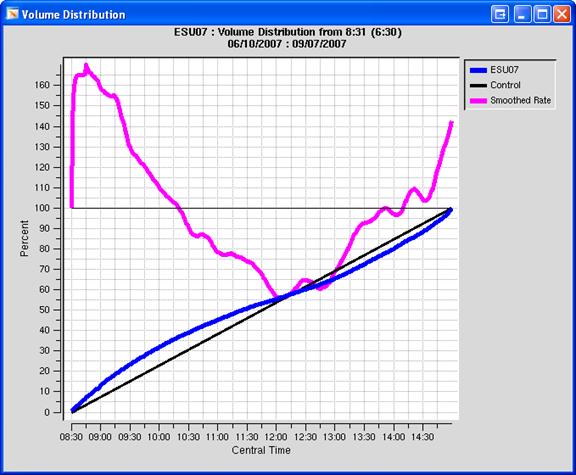
Figure 3: Intraday Volume Distribution
Figure 3 above is a screenshot of an application created to study volume accumulation rates. This example was created by accumulating 1-minute regular-session volume over the front-month life of the September, 2007 CME S&P 500 e-mini futures contract. The blue curve labeled ESU07 shows how volume accumulated over the average session during this period. For example, typically 40% of the session volume had accumulated by 10:30 AM (Central time). The black line labeled Control shows how volume would accumulate if the rate were constant throughout the session. The magenta curve labeled Smoothed Rate plots the instantaneous slope of the ESU07 curve, smoothed over several minutes, and then normalized to the slope of the Control line. For example, during the first 45 minutes of trading, volume typically accumulated at a rate more than 150% of the average rate, and fell to its minimum rate of about 55% of the average rate around noon. Similar curves are observed for electronic energy, metals and agricultural futures markets. Curves like this, combined with comparisons such as Figure 2, suggest the reason why technical traders may find that trading strategies utilizing time-based indicators “don’t work” over the lunch hours.
Estimating Volume
In theory, one could use curves such as Figure 3 to estimate total session volume early in the session, and then estimate session volatility (or a lower bound) by means of the volume-volatility relationship such as Figure 1. In practice, estimates made early in the session are woefully inaccurate, e.g., when the market is ‘waiting’ for the mid-session release of highly-anticipated news. However, even inaccurate estimates may be useful as objective measures of relative trading activity from session to session, and can certainly inform expectations of volatility for the remainder of the session.
Viewing estimated volume as the session average rate per minute simplifies session-to-session and intra-session comparisons of volume rates. An application was created for this purpose, and a screenshot appears as Figure 4 below. The application uses volume distribution curves to compute the estimated session volume rate (i.e., the slope of the Control line) and the immediate estimate based on the time of day (i.e., adjusted from the Smoothed Rate curve) by observing how much volume has accumulated since the beginning of the session. A history of the estimates at 30-minute intervals is also presented. In this example there appears to have been an ‘unexpected’ surge in trading an hour or so into the session.
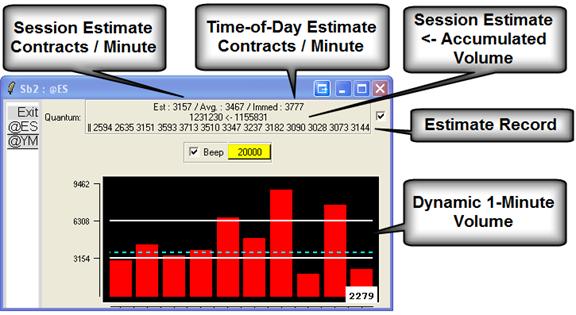
Figure 4: Estimated and Immediate Volume
The lower part of the application is a dynamic 1-minute volume display. Unlike a typical chart that would reset a new volume bar to 0 at 60-second intervals, the rightmost bar in this display always shows the volume accumulated over the most recent 60 seconds, the bar to its left shows the previous 60 seconds and so on. The display is scaled to and displays the estimated 1-minute volume-rate levels. This application provides a concise snapshot of historical intraday and immediate volume trends that might inform trading decisions.